Hosoda ProjectionsThis script, written in Pine Script v5, introduces a technical analysis tool called "Hosoda Projections." Inspired by Ichimoku Kinkō Hyō and wave-based forecasting methods, this indicator helps traders visualize potential future price levels using a combination of pivot detection and projected price movements. It offers a unique way to anticipate market dynamics and define potential targets, making it particularly useful for those who seek to combine historical price patterns with forward-looking strategies.
The script works by detecting key pivot points in the market using a customizable lookback period and then calculating a ZigZag pattern based on price fluctuations that exceed a specified percentage threshold. These pivots are used to identify three recent swing points, which serve as the foundation for projecting possible future price levels. Using these swings, the script generates levels that correspond to Fibonacci-based extensions and projections, such as 38.2%, 61.8%, 100%, 161.8%, and additional extensions like 261.8% and 361.8%. These levels are visualized on the chart as horizontal lines and labeled with their respective values for easy interpretation.
The primary advantage of the Hosoda Projections script is its ability to provide a structured approach to identifying potential price targets. By leveraging the natural rhythm of price movements, it offers insights into where the market might find support or resistance in the future. This can help traders refine their entry and exit points, manage risk more effectively, and gain a deeper understanding of market sentiment. Additionally, the dynamic nature of the projections adapts to new price data, ensuring the tool remains relevant across changing market conditions.
This script is particularly valuable for traders who appreciate the harmony between historical price action and predictive analysis. Whether you are trading forex, stocks, or cryptocurrencies, the Hosoda Projections tool can enhance your trading strategy by providing actionable and visually intuitive forecasts.
Cerca negli script per "pivot points"

Advanced Stochastic [CryptoSea]The Advanced Stochastic Indicator is a sophisticated tool designed to enhance market analysis through detailed stochastic calculations. This tool is built for traders who seek to identify market divergences and pivot points with higher accuracy.
Key Features
Multi-Layer Stochastic Analysis: Tracks both standard and smoothed stochastic values to provide a granular view of market momentum.
Divergence Detection: Automatically detects both regular and hidden bullish and bearish divergences, offering critical insights into potential market reversals.
Adaptive Oscillator Display: Features customizable display options for the stochastic oscillator, allowing traders to view data in Default, Histogram, or Both modes.
Customizable Lookback Periods: Users can set specific lookback periods for divergence analysis and stochastic calculations, tailoring the tool to fit various trading strategies.
In the example below, there is a bearish divergence above 0. You would first want the stoch to break below the 0 level as a show of strength, this would be an aggressive entry, a higher probability option would be to wait for the stoch to retest and reject from 0 which is what we have a few candles later.
How it Works
Stochastic Calculation: Computes the stochastic oscillator by smoothing the %K line over a user-defined period, then applying a second smoothing for the %D line.
Pivot Point Analysis: Utilizes advanced algorithms to find low and high pivot points based on the oscillator values, crucial for spotting trend reversals.
Colour-Coded Divergence Alerts: Utilizes color codes to highlight divergence signals directly on the chart, aiding in quick visual analysis.
Responsive Threshold Settings: Includes options to adjust the sensitivity of divergence detection, ensuring that only significant divergences are highlighted.
In the example below, we have 2 divergence signals. The first a bullish one which fails to break above 0. The second signal is given above 0 so you would want a retest and a show of strength when the stoch returns to 0 but it fails to hold. Both of these divergence signals are invalidated.
Application
Strategic Decision-Making: Assists traders in making informed decisions by providing detailed analysis of stochastic movements and divergence.
Trend Confirmation: Reinforces trading strategies by confirming potential reversals with pivot point detection and divergence analysis.
Customized Analysis: Adapts to various trading styles with extensive input settings that control the display and sensitivity of oscillator data.
The Advanced Stochastic Indicator by is an invaluable addition to a trader's toolkit, offering depth and precision in market trend analysis to navigate complex market conditions effectively.

Pivots and SwingsThis indicator displays simple pivots of varying degrees and connects them into swings whilst displaying the information of each swing.
First order pivot highs are confirmed when the N number of bars each side of the bar in question have a lower high whilst a first order pivot low is confirmed when the N number of bars on each side of the bar in question have a higher low. In this script N is set to 2 as a default, so when the middle bar of a set of 5 bars has the highest high, then it is considered a first order pivot high and vice versa for lows.
Second order pivot highs are confirmed when a first order pivot is higher than the first order pivot points on either side of the pivot point in question. Second order pivot lows are confirmed when a first order pivot low is lower than the first order pivot lows either side of the pivot in question.
Third order pivots follow the same logic but consider the highest and lowest second order pivots
A quick note on how the bars are coloured basis trends. If price breaks through the last first order pivot high, the bars will be coloured in a (default) green sequence and will stay green until price moves back below the most recent first order pivot low, at which time it will revert to a (default) red sequence.
The information about the duration and magnitude of the swings are displayed in an effort to identify when a swing leg of an overall trend may be shortening which signifies a weakening trend, or lengthening to signify a trend that is gaining in strength.
I hope you find this indicator useful!

MLPivotsBreakoutsLibrary "MLPivotsBreakouts"
Utilizes k-NN machine learning to predict breakout zones from pivot points, aiding traders in identifying potential bullish and bearish market movements. Ideal for trend-following and breakout strategies.
breakouts(source, pivotBars, numNeighbors, maxData, predictionSmoothing)
Parameters:
source (float) : series float: Price data for analysis.
pivotBars (int) : int: Number of bars for pivot point detection.
numNeighbors (int) : int: Neighbors count for k-NN prediction.
maxData (int) : int: Maximum pivot data points for analysis.
predictionSmoothing (int) : int: Smoothing period for predictions.
@return : Lower and higher prediction bands plus pivot signal, 1 for ph and -1 for pl.

3 Pivots Interpolation BreakoutsI designed the '3 Pivots Interpolation Breakouts' indicator to intuitively identify breakout opportunities using pivot points. This tool stems from my need to anticipate market direction and capitalize on breakouts. It uses a line interpolated from three pivot highs or lows to forecast upcoming breakouts. This offers a straightforward way to visualize potential bullish and bearish breakouts with color-coded extrapolations. The aim is to simplify breakout detection, enhancing your trading strategy with precise, actionable insights.
TrendLine ScythesTrendline Scythes is a script designed to automatically detect and draw special curved trendlines, resembling scythes or blades, based on pivotal points in price action. These trendlines adapt to the volatility of the market, providing a unique perspective on trend dynamics.
🔲 Methodology
Traditional trendlines connect consecutive pivot points on a price chart, providing a linear representation of trend direction. However, this script employs a distinctive methodology by automatically detecting price pivots and then calculating special curved trendlines based on the Average True Range (ATR) of the price. This introduces a curvature to the trendlines, resembling scythes, offering a unique way to interpret market trends.
🔲 Auto Breakout and Target Detection
Trendline Scythes includes features for automatic breakout detection, signaling potential trend changes. Additionally, the script assists in target detection, helping traders set realistic and data-driven profit-taking levels based on market volatility and user adjustment.
🔲 Utility
Trend Confirmation - Use Trendline Scythes to confirm existing trends by observing how price interacts with the curved trendlines.
Breakout Signals - Auto-detection of breakouts adds a proactive element to your trading strategy, helping you stay ahead of potential trend reversals.
Target Setting - Utilize the script to set profit-taking targets based on volatility, aligning with the current market conditions.
🔲 Settings
Pivot Length - Swing detection length
Scythe Length - Adjusts the length of the scythes blade
Sensitivity - Controls how restrained the target calculation is, higher values will result in tighter targets.
🔲 Alerts
Breakout
Breakdown
Target Reached
Target Invalidated
As well as the option to trigger 'any alert' call.
Trendline Scythes is a versatile tool combining the benefits of traditional trendlines with the dynamic adaptability of curved lines for a unique approach to trend analysis.

Net Positions (Net Longs & Net Shorts) - By LeviathanThis script is an experimental indicator that visualizes the entering and exiting of long and short positions in the market. It also includes other useful tools, such as NL/NS Profile, NL/NS Delta, NL/NS Ratio, Volume Heatmap, Divergence finder, Relative Strength Index of Net Longs and Net Shorts, EMAs and VWMAs and more.
To avoid misinterpretation, it's important to understand some basics. The “real” ratio between net long and net short positions in a given market is always 1:1. A futures contract is an agreement between two parties to buy or sell an underlying asset at an agreed-upon price. Each contract has a long side and a short side, with one party agreeing to buy (long) and the other party agreeing to sell (short) the asset at the agreed-upon price. The long position holder anticipates that the asset's price will rise, while the short position holder expects it to fall. Because every futures contract involves both a buyer and a seller, it is impossible to have more net longs than net shorts or vice versa (in terms of the net value). For every long position opened, there must be a corresponding short position taken by another market participant (and vice versa), thus maintaining the 1:1 ratio between longs and shorts. While there can be an imbalance in the number of traders/accounts holding long and short contracts, the net value of positions held on each side remains 1 to 1.
Open Interest (OI) is a metric that tracks the number of open (unsettled) contracts in a given market. For example, Open Interest of 100 BTC means that there are currently 100 BTC worth of longs and 100 BTC worth of shorts open in the market. There may be more traders on one side holding smaller positions, and fewer traders on the other side holding larger positions, but the net value of positions on one side is equal to the net value of positions on the other side → 100 BTC in longs and 100 BTC in shorts (1:1). Consider a scenario in which a trader decides to open a long position for 1 BTC at a price of HKEX:30 ,000. For this long order to be executed, a counterparty must take the opposite side of the contract by placing an order to short 1 BTC at the same price of HKEX:30 ,000. When both the long and short orders are matched and executed, the open interest increases by 1 BTC, reflecting the addition of this new contract to the market.
Changes in Open Interest essentially tell us 3 things:
- OI Increase - new positions entered the market (both longs and shorts!)
- OI Decrease - positions exited the market (both longs and shorts!)
- OI Flat - no change in open positions due to low activity or simply lots of transfers of contracts
However, different concepts can be used to analyze sentiment, aggressiveness, and activity in the market by analyzing data such as Open Interest, price, volume, etc. This indicator combines Open Interest data and price action to simplify the visualization of positions entering and exiting the market. It is based on the following concept:
Increase in Open Interest + Increase in price = Longs Opening
Decrease in Open Interest + Decrease in price = Longs Closing
Increase in Open Interest + Decrease in price = Shorts Opening
Decrease in Open Interest + Increase in price = Shorts Closing
When "Longs Opening" occurs, the OI Delta value is added to the running total of Net Longs, and when "Longs Closing" occurs, the OI Delta value is subtracted from the running total of Net Longs.
When "Shorts Opening" occurs, the OI Delta value is added to the running total of Net Shorts, and when "Shorts Closing" occurs, the OI Delta value is subtracted from the running total of Net Shorts.
To summarize:
Net Longs: Cumulative value of Longs Opening and Longs Closing (LO - LC)
Net Shorts: Cumulative value of Shorts Opening and Shorts Closing (SO - SC)
Net Delta: Net Longs - Net Shorts
Net Ratio: Net Longs / Net Shorts
This is the fundamental logic of how this script functions, but it also includes several other tools and options. Here is an overview of the settings:
Type:
- Net Positions (display values of Net Longs, Net Shorts, Net Delta, Net Ratio as described above)
- Relative Strength (display Net Longs, Net Shorts, Net Delta, Net Ratio in the form of a momentum oscillator that measures the speed and change of movements. Same logic as RSI for price)
Display as:
- Candles (display the data in the form of candlesticks)
- Lines (display the data in the form of candlesticks)
- Columns (display the data in the form of columns)
Cumulation:
- Visible Range (data is cumulated from the first visible bar on your chart)
- Full Data (data is cumulated from the beginning)
Quoted in:
- Base Currency (all data is presented in the pair’s base currency eg. BTC)
- Quote Currency (all data is presented in the pair’s quote currency eg USDT)
OI Sources
- Pick the sources from where the data is collected (if available).
Net Positions:
- NET LONGS (show/hide Net Longs plot, choose candle colors, choose line color)
- NET SHORTS (show/hide Net Shorts plot, choose candle colors, choose line color)
- NET DELTA (show/hide Net Delta plot, choose candle colors, choose line color)
- NET RATIO (show/hide Net Ratio plot, choose candle colors, choose line color)
Moving Averages:
- Type (choose between EMA and Volume Weighted Moving Average)
- NET LONGS (show/hide NL moving average plot, choose length, choose color)
- NET SHORTS (show/hide NS moving average plot, choose length, choose color)
- NET DELTA (show/hide ND moving average plot, choose length, choose color)
- NET RATIO (show/hide NR moving average plot, choose length, choose color)
Profile:
- Profile Data (choose the source data of the profile)
- Value Area % (set the percentage width of profile’s value area)
- Positions (set the position of the profile to left or right of the visible range)
- Node Size (set the relative size of nodes to make them appear smaller or larger)
- Rows (select the amount of rows displayed by the profile to control granularity)
- POC (show/hide POC- Point Of Control and select its color)
- VA (show/hide VA- Value Area and select its color)
Divergence finder
- Source (choose the source data used by the script to compare it with price pivot points)
- Maximum distance (the maximum distance between two divergent pivot points)
- Lookback Bars Left (the number of bars to the left of the current bar that the function will consider when looking for a pivot point)
- Lookback Bars Right (the number of bars to the right of the current bar that the function will consider when looking for a pivot point)
Stats:
- Show/Hide the Stats table
- Bars Back (choose the length of data analyzed for stats in number of bars)
- Position (choose the position of the Stats table)
- Select Data you want to display in the Stats table
Additional Settings:
- Volume Heatmap (show/hide volume heatmap and select its color)
- Label Offset (select how much the plot label is shifted to the right
- Position Relative Strength Length (select the length used in the calculation)
- Value Label (show/hide OI Delta values when candles are displayed)
- Plot Labels (show/hide the labels next to the plot)
- Wicks (show/hide wick when candles are displayed)
Code used for generating profiles is taken from @KioseffTrading's "Profile Any Indicator" script (used with author's permission)

Autodrawn Pivot Levels IndicatorAn experiment with pinescript's line.new() function. The Autodrawn Pivot Levels indicator draws horizontal lines in areas where prices have been flat, which serve as pivot points. This can be useful for pivot trading as it visually shows several critical levels
fontilabLibrary "fontilab"
Provides function's indicators for pivot - trend - resistance.
pivots(src, lenght, isHigh) Detecting pivot points (and returning price + bar index.
Parameters:
src : The chart we analyse.
lenght : Used for the calcul.
isHigh : lookging for high if true, low otherwise.
Returns: The bar index and the price of the pivot.
calcDevThreshold(tresholdMultiplier, closePrice) Calculate deviation threshold for identifying major swings.
Parameters:
tresholdMultiplier : Usefull to equilibrate the calculate.
closePrice : Close price of the chart wanted.
Returns: The deviation threshold.
calcDev(basePrice, price) Custom function for calculating price deviation for validating large moves.
Parameters:
basePrice : The reference price.
price : The price tested.
Returns: The deviation.
pivotFoundWithLines(dev, isHigh, index, price, dev_threshold, isHighLast, pLast, iLast, lineLast) Detecting pivots that meet our deviation criteria.
Parameters:
dev : The deviation wanted.
isHigh : The type of pivot tested (high or low).
index : The Index of the pivot tested.
price : The chart price wanted.
dev_threshold : The deviation treshold.
isHighLast : The type of last pivot.
pLast : The pivot price last.
iLast : Index of the last pivot.
lineLast : The lst line.
Returns: The Line and bool is pivot High.
getDeviationPivots(thresholdMultiplier, depth, lineLast, isHighLast, iLast, pLast, deleteLines, closePrice, highPrice, lowPrice) Get pivot that meet our deviation criteria.
Parameters:
thresholdMultiplier : The treshold multiplier.
depth : The depth to calculate pivot.
lineLast : The last line.
isHighLast : The type of last pivot
iLast : Index of the last pivot.
pLast : The pivot price last.
deleteLines : If the line are draw or not.
closePrice : The chart close price.
highPrice : The chart high price.
lowPrice : The chart low price.
Returns: All pivot the informations.
getElIntArrayFromEnd() Get the last element of an int array.
getElFloatArrayFromEnd() Get the last element of an float array.
getElBoolArrayFromEnd() Get the last element of a bool array.
isTrendContinuation(isTrendUp, arrayBounds, lastPrice, precision) Check if last price is between bounds array.
Parameters:
isTrendUp : Is actual trend up.
arrayBounds : The trend array.
lastPrice : The pivot Price that just be found.
precision : The percent we add to actual bounds to validate a move.
Returns: na if price is between bounds, true if continuation, false if not.
getTrendPivots(trendBarIndexes, trendPrices, trendPricesIsHigh, interBarIndexes, interPrices, interPricesIsHigh, isTrendHesitate, isTrendUp, trendPrecision, pLast, iLast, isHighLast) Function to update array and trend related to pivot trend interpretation.
Parameters:
trendBarIndexes : The array trend bar index.
trendPrices : The array trend price.
trendPricesIsHigh : The array trend is high.
interBarIndexes : The array inter bar index.
interPrices : The array inter price.
interPricesIsHigh : The array inter ishigh.
isTrendHesitate : The actual status of is trend hesitate.
isTrendUp : The actual status of is trend up.
trendPrecision : The var precision to add in "iscontinuation" function.
pLast : The last pivot price.
iLast : The last pivot bar index.
isHighLast : The last pivot "isHigh".
Returns: trend & inter arrays, is trend hesitate, is trend up.
drawBoundLines(startIndex, startPrice, endIndex, endPrice, breakingPivotIndex, breakingPivotPrice, isTrendUp) Draw bounds and breaking line of the trend.
Parameters:
startIndex : Index of the first bound line.
startPrice : Price of first bound line.
endIndex : Index of second bound line.
endPrice : price of second bound line.
breakingPivotIndex : The breaking line index.
breakingPivotPrice : The breaking line price.
isTrendUp : The actual status of the trend.
Returns: The lines bounds and breaking line.

Gann FanHello All,
For long time I have been getting many requests about Gann Fan indicator. now we have linefill() function in Pine Language and I think it's right time to make Gann Fan Indicator. Many Thanks to Pine Team for adding many new features to the Pine Language!
How this indicator works:
- It calculates midline (1/1)
- By using midline it calculates other lines (1/2, 1/3, 1/4...etc)
- It calculates highest/lowest Pivot Points in last 280 bars.( by default it's 280 bars, you can change it and pivot period )
- It checks the location of highest/lowest Pivot Points
- After the calculation of the Gann Fan lines, it draws lines, puts Labels and paints the zones between the lines according to the colors set by the user
Long time ago I created a special algorithm for calculating the line with 45 degree and I used it for "1/1" line. Anybody who needs it can use this algorithm freely ;)
Options:
You can change following items;
- The colors
- Transparency. Possible values for transparency are from 0 (not transparent) to 100 (invisible)
- Line styles
- Loopback Period (by default it's 280)
- Pivot Period (by default it's 5)
- Enable/disable Labels
- Label location (by default it's 50
Tradingview Gann Fan page : The Gann Fan is a technical analysis tool created by WD Gann. The tool is comprised of 9 diagonal lines (extending indefinitely) designed to show different support and resistance levels on a chart. These angles -drawn from main tops and bottoms- divide time and price into proportionate parts and are often used to predict areas of support and resistance, key tops and bottoms and future price moves. Please note that the chart needs to be scaled properly to ensure the market has a square relationship....
Enjoy!

Pivot and liquidation lines [LM]Hello traders,
I would like to introduce you pivot and liquidation zones. Levels are rendered based on pivot points. We are looking for confluence of liquidation lines in order to have the gist where the market could go. calculation for the liquidation lines are taken from Bybit. It's good to look for line clusters. Indicator doesn't tell you where the market will go but it tells you where are the potential zones of position liquidations
There are several settings:
pivot setting - ordinary pivot lines setting
first leverage - setting for first leverage
second leverage - setting for second leverage
third leverage - setting for first leverage
fourth leverage - setting for second leverage
Hope you will enjoy it.

VMDivergencesTH Volume Momentum Divergences - How It Works
🎯 Overview
This indicator detects divergences between price action and a custom momentum oscillator. Divergences occur when price moves one direction while momentum moves the opposite direction — often signaling potential reversals or trend continuations.
⚙️ The Hidden Oscillator Engine
The oscillator runs in the background (not plotted on chart) and combines two components:
Component 1: Momentum (MACD-style)
Momentum = Fast EMA(12) - Slow EMA(26)
Measures the difference between a fast and slow exponential moving average. Positive = bullish momentum, Negative = bearish momentum.
Component 2: Bollinger Band Distance
Distance = (Price - BB Middle) / Standard Deviation
Measures how far price has strayed from its "normal" range. Values > 2 = overbought territory, Values < -2 = oversold territory.
Hybrid Blend
Final Oscillator = (Normalized Momentum × Blend) + (Band Distance × (1 - Blend))
The Momentum Blend setting (default 1.0) controls the mix:
1.0 = Pure momentum (like MACD)
0.0 = Pure band distance (like Bollinger %B)
0.5 = Equal blend of both
🔍 Pivot Detection
The indicator identifies swing highs and swing lows on both:
Price (using high and low)
Oscillator (using the hybrid oscillator value)
How Pivots Are Found
text
Swing High = A bar where the high is higher than X bars on BOTH sides
Swing Low = A bar where the low is lower than X bars on BOTH sides
The Swing Strength setting (default 5) controls how many bars on each side are required:
Lower values (2-3) = More pivots, more signals, more noise
Higher values (7-10) = Fewer pivots, fewer signals, higher quality
🔀 Divergence Types Explained
1. 🟢 Regular Bullish Divergence (Reversal Signal)
Price: Lower Low ↘ (making new lows)
Oscillator: Higher Low ↗ (momentum improving)
Meaning: Price is falling but momentum is building. The selling pressure is weakening — potential bottom forming.
Visual: Green triangle below bar + solid line connecting lows
2. 🔴 Regular Bearish Divergence (Reversal Signal)
text
Price: Higher High ↗ (making new highs)
Oscillator: Lower High ↘ (momentum fading)
Meaning: Price is rising but momentum is declining. The buying pressure is weakening — potential top forming.
Visual: Red triangle above bar + solid line connecting highs
3. 🟡 Hidden Bullish Divergence (Continuation Signal)
text
Price: Higher Low ↗ (holding above previous low)
Oscillator: Lower Low ↘ (momentum dipped)
Meaning: In an uptrend, price made a higher low but oscillator made a lower low. The oscillator "reset" while price held strong — trend likely to continue UP.
Visual: Green diamond below bar + dashed line
4. 🟠 Hidden Bearish Divergence (Continuation Signal)
text
Price: Lower High ↘ (staying below previous high)
Oscillator: Higher High ↗ (momentum bounced)
Meaning: In a downtrend, price made a lower high but oscillator made a higher high. The oscillator bounced but price couldn't — trend likely to continue DOWN.
Visual: Red diamond above bar + dashed line
5. 🔵 Double Bottom with Divergence (Strong Support)
text
Price: Two lows at SIMILAR levels (within ATR tolerance)
Oscillator: Second low HIGHER than first
Meaning: Price tested the same support twice, but momentum was stronger on the second test — buyers defending that level aggressively.
Visual: Cyan circle below bar + dotted line
6. 🟣 Double Top with Divergence (Strong Resistance)
text
Price: Two highs at SIMILAR levels (within ATR tolerance)
Oscillator: Second high LOWER than first
Meaning: Price tested the same resistance twice, but momentum was weaker on the second test — sellers defending that level.
Visual: Purple circle above bar + dotted line
✅ Validation Filters
Not every pivot pair creates a signal. The indicator applies filters:
Filter Purpose
Min Pivot Distance (default 5) Pivots must be at least 5 bars apart — prevents micro-divergences
Max Pivot Distance (default 50) Pivots must be within 50 bars — prevents stale/irrelevant divergences
DTB Tolerance (default 0.3 × ATR) For double top/bottom, price levels must be within 30% of ATR
📊 Visual Elements
Element Description
Markers Shapes above/below candles when divergence triggers
Lines Connect the two pivot points involved in the divergence
Labels Text tags showing divergence type (REG, HID, DBL)
Glow Effect Thicker semi-transparent line behind main line
Background Flash Brief color flash on signal bar
Status Panel Real-time table showing oscillator value and active signals
🧠 Trading Logic Summary
┌──────────────────────────────────────────────────────────┐
│ DIVERGENCE CHEAT SHEET │
├──────────────────────────────────────────────────────────┤
│ REGULAR BULLISH │ Price ↘ Osc ↗ │ Look for LONGS │
│ REGULAR BEARISH │ Price ↗ Osc ↘ │ Look for SHORTS │
│ HIDDEN BULLISH │ Price ↗ Osc ↘ │ Add to LONGS │
│ HIDDEN BEARISH │ Price ↘ Osc ↗ │ Add to SHORTS │
│ DOUBLE BOTTOM │ Same low, Osc ↗ │ Strong SUPPORT │
│ DOUBLE TOP │ Same high, Osc ↘ │ Strong RESISTANCE │
└──────────────────────────────────────────────────────────┘

Support and ResistanceSupport & Resistance Zones
This indicator automatically identifies support and resistance zones by clustering confirmed pivot highs and lows into statistically valid price areas.
Instead of drawing single horizontal lines, it creates price zones whose width is dynamically controlled using ATR (Average True Range), allowing the zones to adapt to market volatility.
Core Logic
The indicator scans a user-defined number of historical bars and detects pivot highs and pivot lows using a configurable pivot strength.
Each new pivot is evaluated against previously detected zones:
A zone becomes visible only after receiving sufficient confirmation (minimum number of pivot touches).
This ensures that only structurally meaningful levels are drawn.
Zone Construction Rules
Zones are formed by grouping pivot points whose total price range remains within ATR range
Each zone expands dynamically as new pivots confirm it
Zones are drawn as rectangular areas, not lines
Zones extend to the right, remaining active until price structure changes
This approach avoids over-plotting and reduces noise commonly seen in traditional support/resistance tools.
Dynamic Zone Coloring
Zones automatically change color based on current price position:
Support Color → Price is above the zone
Resistance Color → Price is below the zone
Neutral (In-Zone) Color → Price is trading inside the zone
This makes it easy to visually assess market context without additional indicators.
Inputs Explained
Logic Settings
Bars to Apply
Number of historical bars scanned to detect pivots and construct zones.
Pivot Strength
Number of candles required on both sides of a pivot high/low for confirmation.
Min Pivot Confirmation
Minimum number of aligned pivots required before a zone is drawn.
Styling
Support, resistance, and in-zone colors
Zone fill transparency
Why This Approach
Uses price structure, not arbitrary levels
Adapts to market volatility via ATR
Filters out weak, single-touch levels
Works across all markets and timeframes
This indicator is designed to highlight areas of interest, not generate buy or sell signals.
It is best used in combination with trend, momentum, or volume-based tools.

RSI_RDRSI_RD - RSI Divergence Detector (Ryan DeBraal)
This script plots a standard RSI along with advanced automatic divergence detection.
It identifies four types of divergences using pivot logic and configurable
lookback windows. Signals appear directly on the RSI line as plotted marks and labels.
FEATURES
- Standard RSI with user-defined length and source.
- Midline (50), overbought (70), and oversold (30) levels with shaded background.
- Automatic detection of:
• Regular Bullish Divergence
• Regular Bearish Divergence
• Hidden Bullish Divergence
• Hidden Bearish Divergence
- Each divergence type can be toggled on/off individually.
- Pivot-based detection using left/right lookback lengths.
- Range filter (bars since pivot) to avoid stale or invalid divergences.
- Colored markers and labels placed exactly on pivot points.
- Alerts for all four divergence conditions.
PURPOSE
This indicator makes RSI divergence trading systematic and visual.
It highlights when price action disagrees with RSI momentum — often signaling
exhaustion, reversal setups, or continuation opportunities depending on the divergence type.
Ideal for combining with trend filters, VWAP, or ORB structures.

LiquidityThe liquidity swings indicator highlights swing areas with existent trading activity. The number of times price revisited a swing area is highlighted by a zone delimiting the swing areas. Additionally, the accumulated volume within swing areas is highlighted by labels on the chart. An option to filter out swing areas with volume/counts not reaching a user-set threshold is also included.
This indicator by its very nature is not real-time and is meant for descriptive analysis alongside other components of the script. This is normal behavior for scripts detecting pivots as a part of a system and it is important you are aware the pivot labels are not designed to be traded in real-time themselves.
🔶 USAGE
The indicator can be used to highlight significant swing areas, these can be accumulation/distribution zones on lower timeframes and might play a role as future support or resistance.
Swing levels are also highlighted, when a swing level is broken it is displayed as a dashed line. A broken swing high is a bullish indication, while a broken swing low is a bearish indication.
Filtering swing areas by volume allows to only show significant swing areas with an higher degree of liquidity. These swing areas can be wider, highlighting higher volatility, or might have been visited by the price more frequently.
🔶 SETTINGS
Pivot Lookback : Lookback period used for the calculation of pivot points.
Swing Area : Determine how the swing area is calculated, "Wick Extremity" will use the range from price high to the maximum between price close/open in case of a swing high, and the range from price low to the minimum between price close/open in case of a swing low. "Full Range" will use the full candle range as swing area.
Intrabar Precision : Use intrabar data to calculate the accumulated volume within a swing area, this allows obtaining more precise results.
Filter Areas By : Determine how swing areas are filtered out, "Count" will filter out swing areas where price visited the area a number of time inferior to the user set threshold. "Volume" will filter out swing areas where the accumulated volume within the area is inferior to the user set threshold.
🔹 Style
Swing High : Show swing highs.
Swing Low : Show swing lows.
Label Size : Size of the labels on the chart.

Wyckoff Accumulation/Distribution - Enhanced by ChakraWyckoff Accumulation/Distribution - Enhanced Indicator
Overview
An advanced Pine Script v6 indicator that detects Wyckoff accumulation and distribution patterns using RSI-based trend analysis, pivot detection, and volume confirmation. This enhanced version improves upon traditional Wyckoff indicators with cleaner code, English variable names, and additional market structure signals.
Key Features
Wyckoff Phase Detection
Accumulation Phase:
SC (Selling Climax): Bottom pivot with extreme bearish RSI and high volume
AR (Automatic Rally): First bounce after selling climax
ST (Secondary Test): Retest of lows without extreme RSI
SOS (Sign of Strength): Strong bullish breakout with volume confirmation ⭐ NEW
Distribution Phase:
BC (Buying Climax): Top pivot with extreme bullish RSI and high volume
DAR (Automatic Reaction): First drop after buying climax
DST (Distribution Secondary Test): Retest of highs
SOW (Sign of Weakness): Strong bearish breakdown with volume confirmation ⭐ NEW
Market Structure Events
Spring: False breakdown (RSI crosses above lower band) with background highlight
UTAD (Upthrust After Distribution): False breakout (RSI crosses below upper band) with background highlight
Visual Features
Range Boxes: Automatically draws consolidation ranges (gray) that change color on breakout:
🟢 Green = Accumulation (bullish breakout)
🔴 Red = Distribution (bearish breakout)
Pivot Markers: Orange triangles show regular (non-Wyckoff) pivot points
Bar Coloring: Lime bars for bullish trends, purple bars for bearish trends
Color-Coded Labels: All Wyckoff events clearly marked with descriptive text
Customizable Settings
RSI Settings:
RSI Length (default: 14)
Trend Sensitivity (default: 20) - Higher values = more sideways detection
Pivot Settings:
Pivot Length (default: 5) - Controls pivot point detection sensitivity
Display Options:
Toggle range boxes on/off
Toggle regular pivot markers
Toggle bar coloring by trend
Customize label text color
Advanced Detection:
Volume Confirmation toggle - Require high volume for climax events
Volume Threshold (default: 1.5x) - Adjustable volume multiplier
Alerts
8 comprehensive alert conditions:
Selling Climax (SC)
Buying Climax (BC)
Spring detection
UTAD detection
Sign of Strength (SOS)
Sign of Weakness (SOW)
Range Breakout
Improvements Over Original
✅ Pine Script v6 (latest version)
✅ English variable names (was Turkish)
✅ Fixed DAR label bug (was showing "AR")
✅ Added SOS (Sign of Strength) detection
✅ Added SOW (Sign of Weakness) detection
✅ Optional volume confirmation toggle
✅ Organized input groups for better UX
✅ Enhanced visual options
✅ Comprehensive alert system
✅ Cleaner, more maintainable code structure
Best Use Cases
Timeframes: Works on all timeframes; best on 4H, Daily, or Weekly
Markets: Stocks, Forex, Crypto, Indices
Trading Style: Swing trading, position trading, market structure analysis
Combine With: Support/Resistance, Volume Profile, Order Flow analysis
How It Works
The indicator uses RSI to identify market states (sideways, bullish, bearish) and combines this with pivot point detection and volume analysis to identify key Wyckoff events. When price is ranging (RSI between upper/lower bands), it draws a box. On breakout, the box color changes to indicate accumulation or distribution, helping traders identify smart money positioning.
Tips for Use
Lower Trend Sensitivity (10-15) for more signals in trending markets
Higher Trend Sensitivity (25-30) for clearer signals in choppy markets
Enable Volume Confirmation in high-volume markets (stocks, major crypto)
Disable Volume Confirmation in low-volume or forex markets
Watch for Spring/UTAD events within boxes for potential reversals
Version: 1.0
Pine Script: v6
Author: Chakrapani Chittabathina

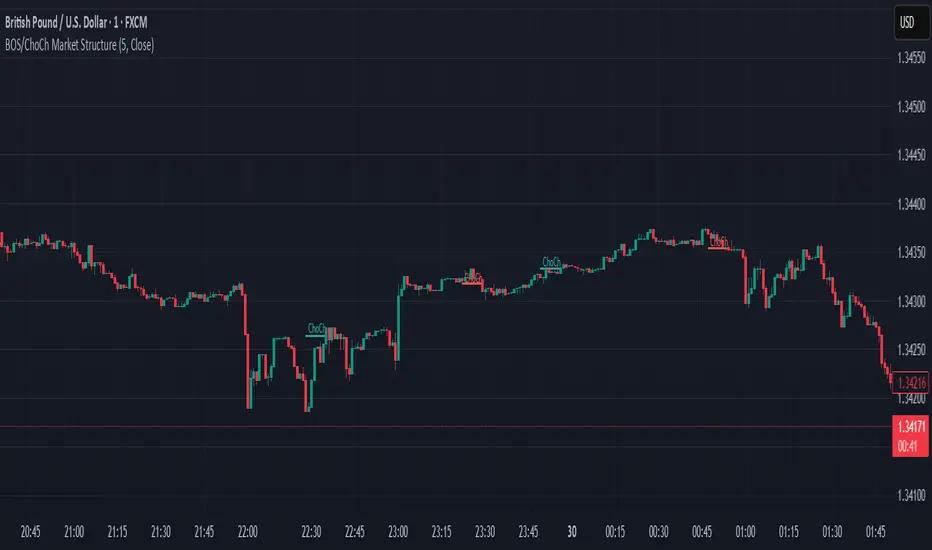
BOS & ChoCh Market StructureBOS/ChoCh Market Structure Indicator
This indicator identifies key market structure shifts using Break of Structure (BOS) and Change of Character (ChoCh) signals based on pivot point analysis.
Concept
Break of Structure (BOS) occurs when price breaks through a significant pivot level in the direction of the current trend, signaling trend continuation. A bullish BOS happens when price breaks above a pivot high while in an uptrend, while a bearish BOS occurs when price breaks below a pivot low during a downtrend.
Change of Character (ChoCh) signals a potential trend reversal. It occurs when price breaks against the prevailing trend - breaking above a pivot high while in a downtrend, or breaking below a pivot low while in an uptrend. This indicates the market structure is shifting.
How It Works
The indicator automatically detects swing highs and lows using configurable pivot strength. When price breaks these levels, it plots:
Color-coded labels (cyan for bullish breaks, red for bearish breaks)
Small horizontal lines marking the exact breakout level
Extended lines from pivot points showing key support/resistance levels
Settings
Pivot Strength - Number of candles on each side required to confirm a swing high/low (default: 5). Higher values identify more significant pivots but produce fewer signals.
Breakout Confirmation - Choose whether breakouts require a candle close beyond the level ("Close") or just a wick touch ("Wick").
Show BOS / Show ChoCh - Toggle visibility of Break of Structure and Change of Character signals independently.
Colors - Customize the colors for bullish (cyan) and bearish (red) signals.
Perfect for swing traders and market structure analysis.
Instant Breakout Strategy with RSI & VWAPInstant Breakout Strategy with RSI & VWAP
This TradingView strategy (Pine Script v6) trades breakouts using pivot points, with optional filters for volume, momentum, RSI, and VWAP. It’s optimized for the 1-second timeframe.
Overview
The strategy identifies breakouts when price crosses above resistance (pivot highs) or below support (pivot lows). It can use basic pivot breakouts or add filters for stronger signals. Take-profit and stop-loss levels are set using ATR, and signals are shown on the chart.
Inputs
Left/Right Pivot Bars: Bars to detect pivots (default: 3). Lower values increase sensitivity.
Volume Surge Multiplier: Volume threshold vs. 20-period average (default: 1.5).
Momentum Threshold: Minimum % price change from bar open (default: 1%).
Take-Profit ATR Multiplier: ATR multiplier for take-profit (default: 9.0).
Stop-Loss ATR Multiplier: ATR multiplier for stop-loss (default: 1.0).
Use Filters: Enable/disable volume, momentum, RSI, and VWAP filters (default: off).
How It Works
1. Pivot Detection
Finds pivot highs (resistance) and lows (support) using ta.pivothigh and ta.pivotlow.
Tracks the latest pivot levels.
2. Volume Surge
Compares current volume to a 20-period volume average.
A surge occurs if volume exceeds the average times the multiplier.
3. Momentum
Measures price change from the bar’s open.
Bullish: Price rises >1% from open.
Bearish: Price falls >1% from open.
4. RSI and VWAP
RSI: 3-period RSI. Above 50 is bullish; below 50 is bearish.
VWAP: Price above VWAP is bullish; below is bearish.
5. ATR
14-period ATR sets take-profit (close ± atr * 9.0) and stop-loss (close ± atr * 1.0).
Trading Rules
Breakout Conditions
Bullish Breakout:
Price crosses above the latest pivot high.
With filters: Volume surge, bullish momentum, RSI > 50, price > VWAP.
Without filters: Only the crossover is needed.
Bearish Breakout:
Price crosses below the latest pivot low.
With filters: Volume surge, bearish momentum, RSI < 50, price < VWAP.
Without filters: Only the crossunder is needed.
Entries and Exits
Long: Enter on bullish breakout. Set take-profit and stop-loss. Close any short position.
Short: Enter on bearish breakout. Set take-profit and stop-loss. Close any long position.
Visuals
Signals: Green triangles (bullish) below bars, red triangles (bearish) above bars.
Pivot Levels: Green line (resistance), red line (support).
Indicators: RSI (blue, separate pane), VWAP (purple, on chart).
How to Use
Apply to a 1-second chart in TradingView for best results.
Adjust inputs (e.g., pivot bars, multipliers). Enable filters for stricter signals.
Watch for buy/sell triangles and monitor RSI/VWAP.
Use ATR-based take-profit/stop-loss for risk management.
Notes
Best on 1-second timeframe due to fast RSI and responsiveness.
Disable filters for more signals (less confirmation).
Backtest before live trading to check performance.
This strategy uses pivots, volume, momentum, RSI, and VWAP for clear breakout trades on the 1-second timeframe.

MarketStructureLibMarketStructure Library
This library extends the "MarketStructure" library by mickes () under the Mozilla Public License 2.0, credited to mickes. It provides functions for detecting and visualizing market structure, including Break of Structure (BOS), Change of Character (CHoCH), Equal High/Low (EQH/EQL), and liquidity zones, with enhancements for improved accuracy and customization.
Functionality
Market Structure Detection: Identifies internal (orderflow) and swing market structures using pivot points, with support for BOS, CHoCH, and EQH/EQL.
Volatility Filter: Only confirms pivots when the ATR exceeds a user-defined threshold, reducing false signals in low-volatility markets.
Trend Strength Metric: Calculates a trend strength score based on pivot frequency and volatility, stored in the Structure type for use in scripts.
Customizable Visualizations: Allows users to configure line styles and colors for BOS and CHoCH, and label sizes for pivots, BOS, CHoCH, and liquidity.
Liquidity Zones: Visualizes liquidity levels with confirmation bars and lookback periods.
Methodology
Pivot Detection: Uses ta.pivothigh and ta.pivotlow with a volatility filter (ATR multiplier) to confirm significant pivots.
Trend Strength: Computes a score as pivotCount / LeftLength * (currentATR / ATR), reflecting trend reliability based on pivot frequency and market volatility.
BOS/CHoCH Logic: Detects BOS when price breaks a pivot in the trend direction, and CHoCH when price reverses against the trend, with labels for "MSF" or "MSF+" based on pivot patterns.
EQH/EQL Zones: Creates boxes around equal highs/lows within an ATR-based threshold, with optional extension.
Visualization: Draws lines and labels for BOS, CHoCH, and liquidity, with user-defined styles, colors, and sizes.
Usage
Integration: Import into Pine Script indicators (e.g., import Fenomentn/MarketStructure/1) to analyze market structure.
Configuration: Set pivot lengths, volatility threshold, label sizes, and visualization styles via script inputs.
Alerts: Enable alerts for BOS, CHoCH, and EQH/EQL events, triggered on bar close to avoid repainting.
Best Practices: Use on forex or crypto charts (1m to 12h timeframes) for optimal results. Adjust the volatility threshold for different market conditions.
Originality
This library builds on mickes’ framework by adding:
A volatility-based pivot filter to enhance signal accuracy.
A trend strength metric for assessing trend reliability.
Dynamic label sizing and customizable visualization styles for better usability. No additional open-source code was reused beyond mickes’ library, credited under MPL 2.0.
Developed by Fenomentn. Published under Mozilla Public License 2.0.

Clean Pivot Lines with AlertsTechnical Overview
This Script is designed for detecting untouched pivot highs and lows. It draws horizontal levels only when those pivots remain unviolated within a configurable lookback window and removes them automatically upon price breaches or sweeps.
Key components include:
Pivot detection logic : Utilizes ta.pivothigh()/ta.pivotlow() (or equivalent via request.security for HTF) with parameterized pivotLength to ensure flexibility and adaptability to different timeframes.
Cleanliness filtering : Checks lookbackBars prior to line creation to skip levels already violated, ensuring only uncontaminated pivots are used.
Dynamic level tracking : Stores active levels in arrays (highLines, lowLines) for continuous real-time monitoring.
Violation logic : Detects both close-based breaks (breakAbove/breakBelow) and wick-based sweeps (sweepAbove/sweepBelow), triggering alerts and automatic teardown.
Periodic housekeeping : Every N (10) confirmed bars, re-verifies “clean” status and removes silently invalidated levels—maintaining chart hygiene and avoiding stale overlays.
Customization options : Supports pivot timeframe override, colors, line width/style, lookback length, and alert toggling.
Utility
This overlay script provides a disciplined workflow for drawing meaningful support/resistance levels, filtering out contaminated pivot points, and signaling validations (breaks/sweeps) with alerts. Its modular design and HTF support facilitate integration into systematic workflows, offering far more utility than mere static pivot plots.
Usage Instructions
1. Adjust `pivot_timeframe`, `pivot_length`, and `lookback_bars` to suit your strategy timeframe and volatility structure.
2. Customize visual parameters as required.
3. Enable alerts to receive in-platform messages upon pivot violations.
4. Use HTF override only if analyzing multi-timeframe pivot behavior; otherwise, leave empty to default to chart timeframe.
Performance & Limitations
- Pivot lines confirmation lags by `pivot_length` bars; real-time signals may be delayed.
- Excessive active lines may impact performance on low-TF charts.
- The “clean” logic is contingent on the `lookback_bars` parameter; choose sufficiently high values to avoid false cleanliness.
- Alerts distinguish between closes beyond and wick-only breaches to aid strategic nuance.

Pullback Historical DataIndicator Description: Dados-historico-Pullback
This indicator identifies pivot points (local support and resistance levels) on the chart based on a user-defined period. It calculates the difference between the last found resistance and support levels, displaying this current difference as well as its historical maximum and minimum values.
How to use:
Pivot Period:
Adjust the "Pivot Period" parameter to define how many bars before and after the indicator should look for a pivot point (high or low).
A higher value makes the pivot more conservative, finding stronger and more spaced pivots.
A lower value detects more frequent pivots, sensitive to quick market moves.
Label and Text Color:
You can customize the background color of the label and the text color for better visibility on the chart.
Label Size:
The indicator offers four label sizes:
XS (Extra Small): small label to save space.
S (Small): compact and readable size.
M (Medium): default size, a balance between readability and space.
L (Large): bigger label for more emphasis.
If you choose an invalid value, the default M (Medium) size will be used automatically.
Example to adjust the Pivot Period:
Setting the Pivot Period to 3 means the indicator will look for pivots within 3 bars before and after each point. This produces many pivots, including smaller ones and noise. It’s useful for fast trades or scalping.
Setting it to 10 means the indicator looks for pivots farther apart, producing fewer signals but more significant ones, suitable for more conservative analysis.
I recommend starting with a middle value like 5 and testing how the indicator behaves on your chart. Then adjust up or down depending on your trading style and timeframe.

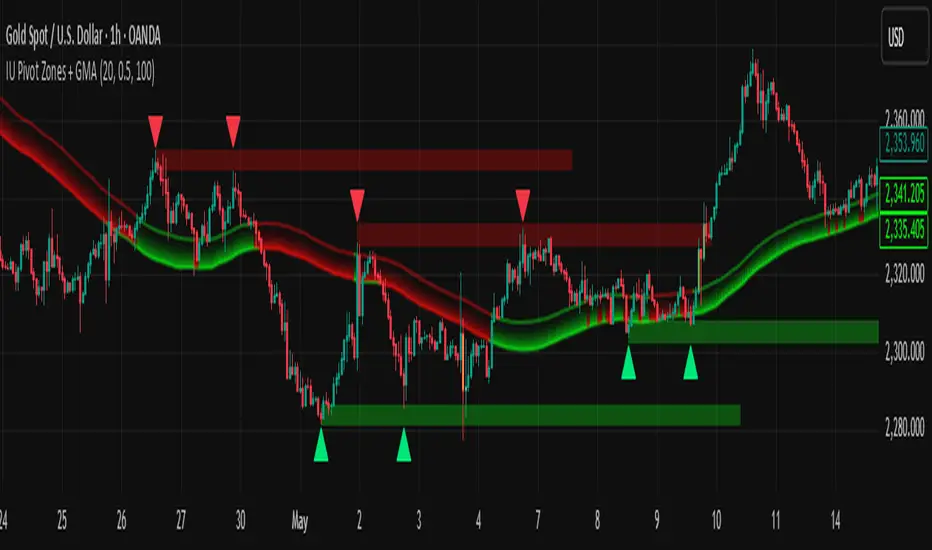
IU Pivot Zones + GMADESCRIPTION:
IU Pivot Zones + GMA is a smart price-action-based indicator that detects meaningful support and resistance zones formed through pivot highs/lows while combining them with dynamic zone generation and Geometric Moving Averages (GMA). This tool is built to help traders visualize institutional breakout/rejection zones with clear, logical mapping and live box management — helping you stay ahead of the move.
The indicator is designed for intraday, swing, and positional traders who want to enhance their trading decisions with visual confluence zones and market structure logic.
USER INPUTS
* Pivot point Lengths: Number of bars used to detect pivot highs/lows
* Zone length: Controls the thickness of the support/resistance zone; higher values create wider zones
* GMA Length: Period for calculating the geometric moving averages based on highs and lows
* Allow Bar/candle Color: Enables or disables special candle coloring when price interacts with the zones
LOGIC OF THE INDICATOR:
* Detects pivot highs and pivot lows using the user-defined length
* Compares consecutive pivot levels to determine if they fall within a valid ATR-based price band to form a zone
* If confirmed, the indicator dynamically plots a resistance or support box between those pivot points, colored respectively (red for resistance, green for support)
* The boxes update in real-time based on price action. If price respects the zone, the box extends forward. If price breaks the zone, the box disappears
* Geometric Moving Averages (GMA) based on logarithmic mean of highs and lows are plotted to offer a trend bias
* Candles that touch the top of the support zone are colored yellow, and those touching the bottom of the resistance zone are orange, enhancing zone reaction visibility
WHY IT IS UNIQUE:
* Uses logarithmic-based GMAs, which are smoother and less reactive than traditional moving averages
* ATR-based zone logic makes it adaptive to volatility instead of using fixed-width zones
* Combines structural levels (pivots), volatility filters (ATR), and trend overlays (GMA) in one unified tool
* Real-time zone extension and disappearance logic based on price interaction
HOW USER CAN BENEFIT FROM IT:
* Spot high-probability breakout or reversal zones that price respects consistently
* Use the GMA cloud for trend confirmation — for example, bullish bias when price is above both GMAs
* Build price action strategies around zone touches, breakouts, or rejections
* Use color-coded candles as real-time alerts for potential entry/exit signals near S/R levels
* Save time by avoiding manual marking of zones on charts across timeframes
DISCLAIMER:
This indicator is created for educational and informational purposes only. It does not constitute financial advice or a recommendation to buy or sell any asset. All trading involves risk, and users should conduct their own analysis or consult with a qualified financial advisor before making any trading decisions. The creator is not responsible for any losses incurred through the use of this tool. Use at your own discretion.
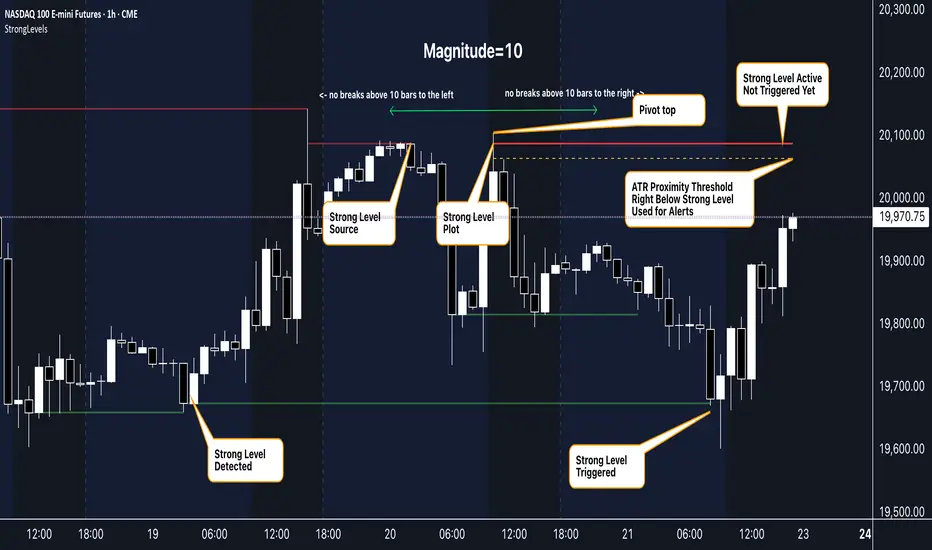
Strong Levels (with Proximity Alerts)█ OVERVIEW
The "Strong Levels (with Proximity Alerts)" indicator offers a fresh approach to identifying support and resistance levels, inspired by the RexDog Trading System (RDTS). It pinpoints significant price reversals using a unique filtering method that reduces noise and enhances reliability. Paired with customizable ATR-based proximity alerts, this indicator empowers traders to track critical price zones with precision.
█ FEATURES
- Rooted in RDTS :
Inspired by the RexDog Trading System (RDTS), it highlights major pivot points where price executed sharp turnarounds, ensuring levels carry true market weight.
- Second-Highest/Lowest Open/Close Method :
Resistance levels use the *second-highest open/close* near pivot highs, while support levels use the *second-lowest open/close* near pivot lows—skipping extreme wicks for cleaner, more dependable lines.
- ATR-Driven Proximity Alerts :
Customizable proximity thresholds, calculated using the Average True Range (ATR), warn traders when price approaches key levels—a standout feature not found in most support/resistance indicators.
- Flexible Customization :
- Magnitude : Tweak pivot sensitivity (default: 10).
- Line Colors : Set resistance (red by default), support (green), and proximity (yellow) lines.
- Line Options : Adjust line origins, transparency for breached levels, and the maximum number of levels shown.
- ATR Settings : Fine-tune proximity sensitivity with ATR length and multiplier.
█ HOW TO USE
1. Add to Chart :
Find "Strong Levels (with Proximity Alerts)" in TradingView’s indicator library and apply it.
2. Read the Lines :
- Red Lines : Resistance, derived from the second-highest open/close near pivot highs.
- Green Lines : Support, based on the second-lowest open/close near pivot lows.
- Yellow Dashed Lines : Proximity thresholds (optional), signaling when price nears a level.
3. Customize :
- Raise `Magnitude` for stronger levels or lower it for more detail.
- Adjust colors, transparency, and max levels to fit your preferences.
- Toggle proximity thresholds on/off based on your trading style.
- Enabling *Plot Line from Actual Pivot Bar* offers a cleaner chart but may mislead as lines plot into the past.
4. Set Alerts :
- Open TradingView’s alert menu (the three dots ... dropdown menu next in indicator list has an option "Add alert on ...") and choose "Approaching Level" or "Level Touched.".
- Don't forget to choose the right Trigger condition, which by default is "Only Once". I usually set it to "Once Per Bar".
- Tailor alert conditions to your needs.
█ LIMITATIONS
- Past-Based Levels :
- Relying on historical pivots, it may not always forecast future moves, especially in rapid markets.
- The 'Plot Line from Actual Pivot Bar' option while visually appealing can imply historical significance that didn’t exist at the time. Be mindful of that.
- Volatility Sensitivity :
High volatility widens ATR-based thresholds, which might trigger alerts too soon.
- Display Management :
A cap on max levels avoids clutter, but tweaking `Max Levels` may be needed across timeframes.
█ ACCOMPANYING CHART
The chart showcases the indicator’s unique edge:
- A pivot high and low are flagged, with nearby bars highlighted.
- Resistance is plotted at the *second-highest open/close* around the pivot high, bypassing the highest wick.
- Support is set at the *second-lowest open/close* near the pivot low, ignoring the deepest wick.
- Yellow dashed proximity lines illustrate how the indicator warns traders as price nears these zones.
- Annotations clarify how skipping extreme wicks creates cleaner, more actionable levels.
█ HOW TO USE
1. Add to Chart :
Locate "Strong Levels (with Proximity Alerts)" in TradingView’s indicator library and apply it to your chart.
2. Read the Lines :
- Red Lines**: Resistance levels, calculated from the second-highest open/close near pivot highs.
- Green Lines : Support levels, derived from the second-lowest open/close near pivot lows.
- Yellow Dashed Lines : Optional proximity thresholds, alerting you when price nears a level.
3. Customize :
- Increase `Magnitude` for stronger, less frequent levels or decrease it for more granularity.
- Modify colors, transparency, or the maximum number of levels to suit your style.
- Enable or disable proximity thresholds as needed.
4. Set Alerts :
- Access TradingView’s alert menu and select "Approaching Level" or "Level Touched."
- Adjust conditions to match your trading preferences.
5. My Personal Approach :
I prefer using this indicator on higher timeframes, like hourly or daily charts. I adjust my `Magnitude`, so it doesn't trigger too often and set my alerts to trigger "Once Per Bar". When price nears a level, I get an alert and I anticipate a reaction but avoid placing limit orders blindly. Instead, I switch to smaller timeframes and combine it with other tools for confirmation before making a trade. This saves me a lot of screen time, and allows me to focus when it matters.